“Sanity, remember, does not mean living in the same world as everyone else; it means living in the real world.” — Frank J. Sheed, Theology and Sanity (1946)
Though climate scientists use complex mathematical formulas to justify changes to the temperature record and to justify the associated confidence intervals, simple arithmetic shows that either the former or the latter, or both, are wrong.
Though “adjustment” and “change” and even “alteration” are fairly synomymous in ordinary language, I am not examining directly here the end result of the multi-step process which is usually called "adjustment" of the temperature record; I am examining, rather, the alteration of anomalies as published monthly by GISS, which I will consistently call “change(s)”.
Considering the drastic changes to the recent temperature record that came with GISS’s “pause-buster” effort, I thought it might be illuminating to look at temperature-record changes vis-a-vis the asserted confidence intervals. (For a brief explanation of CI, see Confidence interval.) Doing so can help us to see, from the climate scientist’s own claims derived from their own mathematics, whether recent changes are justified.
These confidence intervals are at the 95% level. For documentation, see this image, the GISTEMP FAQ, and Global Surface Temperature Change.
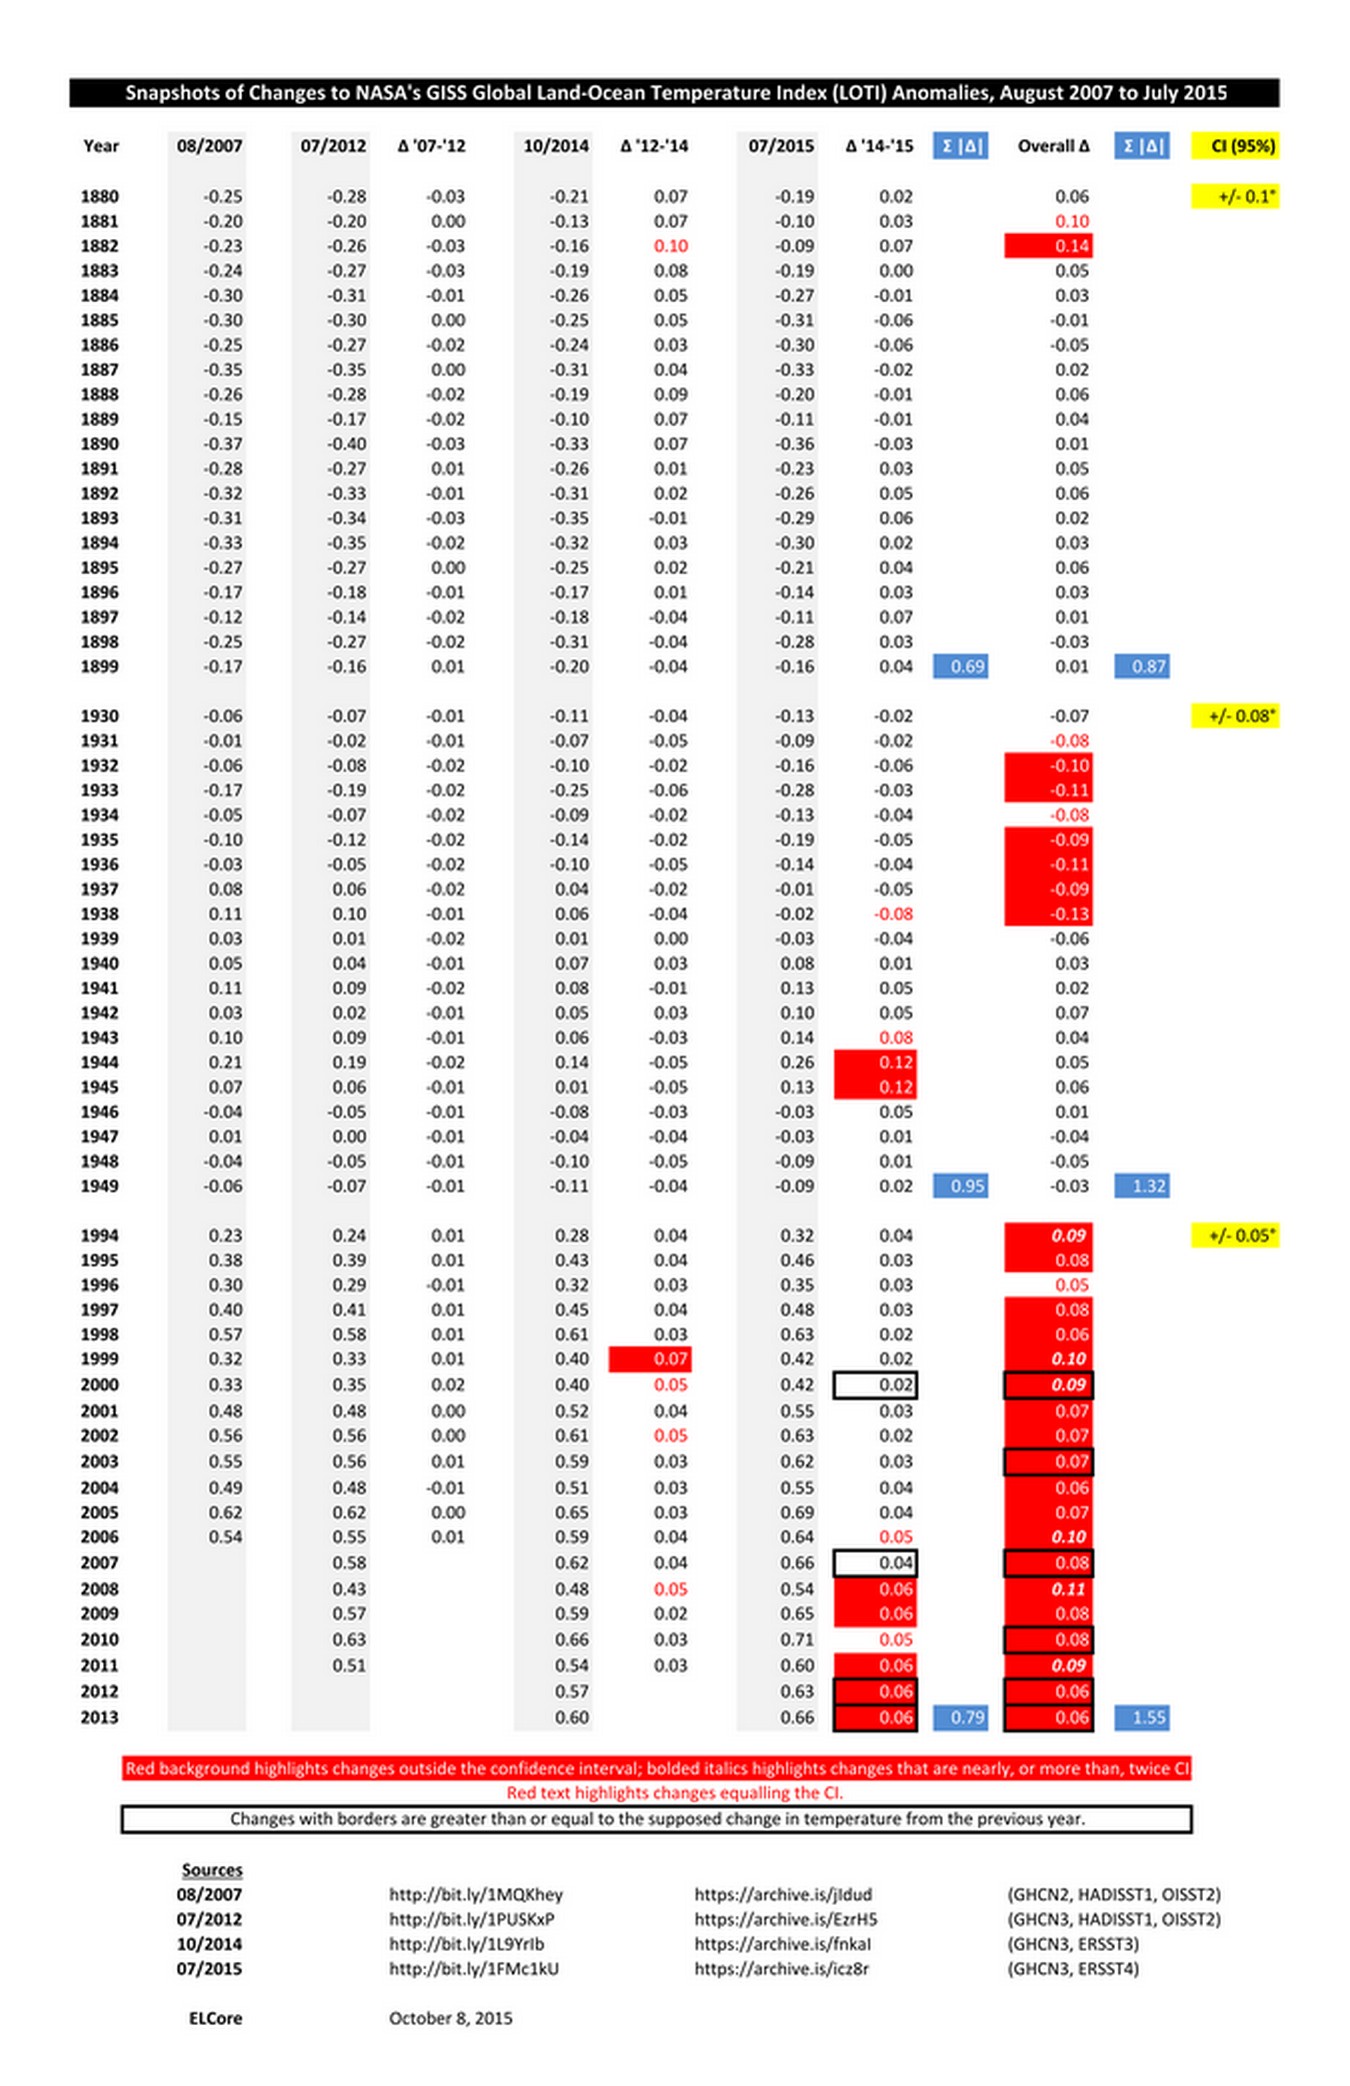
The first published “pause-buster” data was for June 2015; that is, the data published in July 2015 on the GISTEMP website. I used that as my starting point, going backwards through the published data that’s archived on the "Wayback Machine". (Here are the relevant searches: GHCN V2 and GHCN V3.)
Besides using (1) an early version of the data, with GHCN V2 and HADISST V1 / OISST V2, I settled on three change points to examine: (2) after the change from GHCN V2 to GHCN V3; (3) after the change from HADISST V1 / OISST V2 to ERSST V3; and, (4) after the change from ERSST V3 to ERSST V4 — i.e., the “pause buster”. These, then, are the data files:
Since the “pause-buster” data is in the second half of the calendar year, I chose the other three data sets from the second half of the calendar year. And I went back only to 2007 because that can show us how much the data has been altered in the short span of eight years.
So we can see a representative sample of the data at a glance, we’ll look at a 20-year period in each confidence-interval category:
I chose the first and last periods because they are, obviously, the earliest and latest 20-year periods. (2014 is excluded because the October 2014 data does not provide a full year for comparison.) I chose 1930-1949 because a whole lotta adjustin’s been goin’ on for the 1930s, and I noticed there were quite dramatic changes for the 1940s in the “pause buster”.
Before we look at the data, though, let’s state a few givens:
The givens follow necessarily from the very concept of confidence intervals. And — to forestall knee-jerk objections that I have somehow plucked some kind of fruit here — these givens must hold true no matter which datasets, and no matter which time periods in each confidence-interval category, would be chosen for comparison.
In the following chart, the shaded columns are the anomalies as published by GISS in the month indicated; the in-between columns show the change (Δ) from one set of anomalies to the next; the “Overall Δ” shows the overall change from the earliest dataset to the most recent. Two "Σ |Δ|" columns, with values shaded blue, show the sum of the absolute values of the changes in each period: one column for the “pause-buster” change, and one for the overall change. Changes with a red background exceed the confidence interval; those with bolded, italicized numbers are nearly twice, or more than twice, the CI. Changes with red text are at CI. And, changes in cells with borders are greater than or equal to the supposed change in temperature from the previous year.
Please note that by calculating the change from, for instance, July 2012 to October 2014, I do not mean to imply that there were no intervening changes. Of course, many months elapsed between the publication of those two datasets, and there must have been many intervening changes. We’re just looking at a selection of datasets determined by the change points mentioned above.
Contrary to the givens — which, remember, follow from the very nature of confidence intervals — the sum of the absolute value of the changes in each succeeding period exceeds that of the changes in the earlier periods: that is, the changes in successive periods were larger and larger. Moreover, though the CI is progressively smaller, more changes exceed CI in the intermediate period, and even more exceed CI in the latest (current) period, than in the earliest.
The largest changes are made in the period with the smallest confidence interval. That is the very opposite of what should happen.
Let’s look at the size of the changes, including the direction, in a different way. Here’s a breakdown of the 20 overall changes in each period:
It simply cannot be true that both the changes and the confidence intervals are justified. Either the changes are unjustified, or the confidence intervals are unjustified, or both are unjustified.
Indeed, despite the complexity of the math used to calculate and justify the confidence intervals, the changes themselves, as they have actually been done from month to month and year to year, tend to indicate the confidence intervals asserted by GISS are ordered backwards. For the 19th Century, shouldn’t it be more like +/- 0.05°C? And, for the 21st Century, more like +/- 0.1°C?
Keeping that idea in mind, several changes are noteworthy: for 1994, 1999, 2000, 2006, 2008, and 2011, the overall changes are nearly, or more than, twice the asserted CI of +/- 0.05°. Moreover, the calculated average (not shown in the chart) of the 20 overall changes in the 19th Century is only 0.04° — 0.0345° precisely — though the asserted CI for that period is +/- 0.1°.
Also, the changes for years 2000, 2003, 2007, 2010, 2012, and 2013 are especially noteworthy: the overall change for each of those years — and, in four cases, the “pause-buster” change itself — is greater than the supposed change in temperature from the previous year. For example, in 2007, the “pause-buster” change (0.04°) and the overall change (0.08°) are greater than the supposed change in temperature from 2006 to 2007 (0.66° - 0.64° = 0.02°).
“With more complicated instances there is no more common error than to assume that, because prolonged and accurate mathematical calculations have been made, the application of the result to some fact of nature is absolutely certain.” — A.N. Whitehead, An Introduction to Mathematics (1911).
Odd, isn’t it, how the changes get larger and more unjustifiable the more they approach the present? This is colorfully illustrated by the predominance of red, and of bolded italics, and of bordered cells in the lower right-hand corner of the chart. Yet, as we can see by comparing the September 2015 version of the GLOTI graph with the February 2011 version, GISS has not seen fit to alter its confidence intervals in years.
At its simplest, the AGW hypothesis is that CO2 is Earth’s thermostat, and human activity has been turning the knob and heating up the globe. As time goes by, the keepers of the temperature record have been making more changes, and more unjustifiable changes, that increase the warming trend. It is becoming difficult to avoid concluding that they are doing so — deliberately or not, wittingly or not — to fit with the hypothesis.
© ELC 2016